A Data Flow Diagram (DFD) is a traditional visual representation of the information flows within a system.
2 types:
- Logical: Logical diagrams display the theoretical process of moving information through a system. - like where the data comes from, where it goes, how it changes, and where it ends up.
- Physical: Physical diagrams show you the practical process of moving information through a system. - show how your system’s specific software, hardware, files, employees, and customers influence the flow of information.
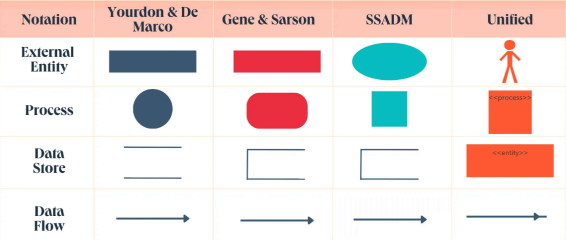
Symbols:
-
External Entity
- Also known as - terminators, sources, sinks, or actors.
- outside systems that send or receive data to and from the diagrammed system.
- They’re either the sources or destinations of information, so they’re usually placed on the diagram’s edges -
Process
- process is a procedure that manipulates the data and its flow by taking incoming data, changing it, and producing an output.
- can do this by performing computations and using logic to sort the data or change its flow of direction.
- Processes usually start from the top left of the DFD and finish on the bottom right of the diagram. -
Data Store
- Data stores hold information for later use, like a file of documents that’s waiting to be processed.
- Data inputs flow through a process and then through a data store, while data outputs flow out of a data store and then through a process. -
Data Flow
- Data flow is the path the system’s information takes from external entities through processes and data stores.
- With arrows and succinct labels, the DFD can show you the direction of the data flow.
DFD Levels
simple overviews to complex
3 levels - 0, 1 and 2
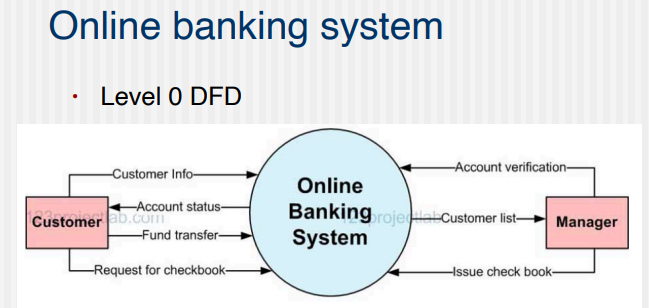
level 0 - also called context diagrams - most common and intuitive - high level system processes or functions and the data sources that flow to and from them.
simple, straight forward overview
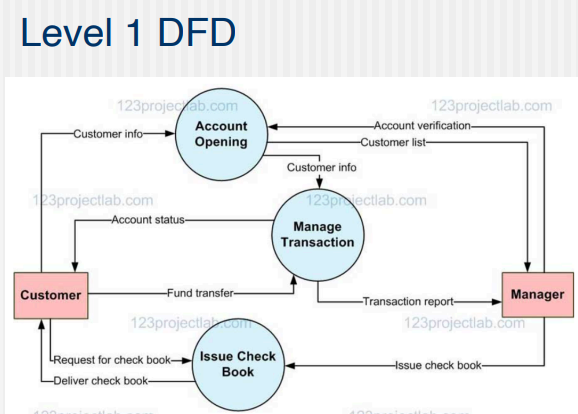
level 1 - Process decomposition - still broad overviews of a system or process but more detailed - they break down the system’s single process node into subprocesses.
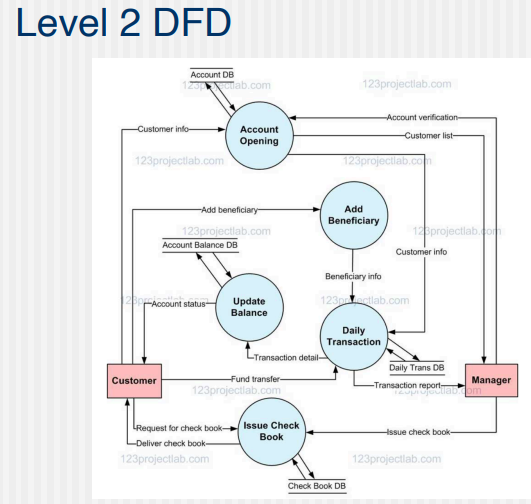
level 2 - dives deeper - deeper into detail by breaking down each level 1 process into granular subprocesses.
Example: